Federal Reserve Chair’s speech lays factual foundation for policy deliberation.
Inequality has become “the defining challenge of our time” – a set of issues potent enough to propel a thick economics tome to the New York Times’ bestseller list. The concern is well placed. Inequality can diminish economic mobility, hinder innovation, slow economic growth, and even fray “the country’s social fabric.” But how should it be measured: by income, wealth, opportunity, or something else? Has inequality changed over time? And what can – and, more importantly, should – we do about it?
Presenting “a factual basis for further discussion” about inequality, the U.S. Federal Reserve (Fed) Chair, Janet Yellen, recently delivered a keynote speech at the Conference on Inequality of Economic Opportunity in Boston.
Yellen first outlined the trend of growing inequality based on her analysis of the Fed’s triennial 6,000 household Survey of Consumer Finances (SCF), and then presented her views on the “building blocks” of economic opportunity. At the same time, the head of the world’s largest central bank offered a glimpse of her normative hand, openly asking whether the trend of increasing inequality “is compatible with values rooted in our nation’s history.”
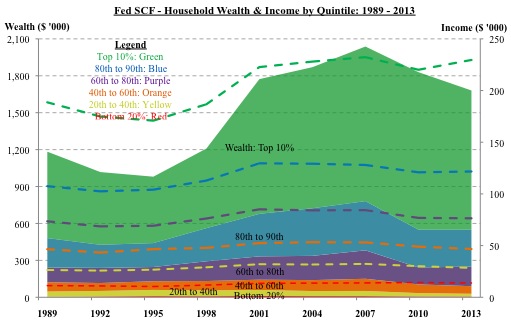
The chart below shows median household net wealth, represented by the solid colored areas, and median annual income, represented by the dashed lines, for the period between 1989 and 2013. The data are drawn from the SCF cited in Yellen’s speech and presented in real, inflation-adjusted 2013 dollars. The chart divides the range of household income levels into quintiles, denoted by color in the legend, with the top quintile bifurcated to highlight the pronounced increases for the top 10%.
For the average American family, represented by the middle quintile in orange, the data paint a grim picture. From 1989 to 2013, the group’s average annual income increased a mere $300, to $46,700; meanwhile, their average net worth fell by $13,600, to $61,700.

Two more aspects of the data are worth highlighting. First, after adjusting for inflation, household incomes below the 80th percentile essentially have not changed between 1989 and 2013, despite substantial real GDP growth. In other words, while the economy has grown, that growth has not really increased paychecks for almost 80% of Americans.
Second, wealth – which includes financial assets, home equity, and business ownership – is distributed even more unequally than income. This dimension of inequality is represented by the contrast in size between the expansive green area, representing the top 10% of households, and the bottom four quintiles. This can largely be attributed to a feedback loop through which high-income households can save and invest discretionary income, generating even more wealth – which some have argued, “grows faster than economic output,” further exacerbating long-term inequality.
Yellen went on to identify “four building blocks” for economic mobility: “resources available for children”; affordable higher education; business ownership; and inheritance. The first two center on education – widely considered essential for economic mobility – and affect most households. The next two directly impact fewer families, but are essential for inter-generational economic mobility, though often perceived as entrenching wealth.
Framing the issue in economic terms, Yellen first notes that “resources available to children in their most formative years,” – primarily, but not entirely, through public education – have been shown to enhance future outcomes. However, many households “have very little to spare for this purpose,” creating an “important role” for public funding. Yet, the mechanics of American educational funding – with half of public school budgets coming from local property taxes – allocate greater financial and teaching resources to already advantaged families. This “unevenness” in funding and quality substantially hinders the “equalizing effect” of public education.
Second, “the large and growing burden of paying” for higher education creates a treacherous barrier to entry for those on the bottom of the American income distribution – but not generally for those towards the top. Since the cost of higher education has “risen much faster than income,” households have had to cover the shortfall with non-dischargeable student loans — which have swollen from $260 billion to over $1.1 trillion outstanding between 2004 and 2013. Thus, while higher education remains “a potent source of economic opportunity,” the accompanying accumulation of life-long debt has also made it an increasingly high-risk, leveraged bet for the families least able to bear it.
Third, Yellen cites business ownership as “vital” for some households to improve their “position in the wealth distribution,” while expressing concern that “it has become harder to start and build businesses.”
Although concentrated towards the top, new business formation not only enhances economic mobility, but may also increase productivity and real wage growth.
Finally, for a “sizable minority below the top,” inheritance remains a “significant source” of economic opportunity. Inheritances are proportionately less concentrated at the top than total wealth, with 7% of inheritances passed on to households in the bottom 50% of the income distribution, despite this group holding only 1% of total wealth in 2013. Moreover, because the average age for receiving an inheritance is 40, the bequests are well timed to bolster major inflection points, such as starting a business or paying for a child’s education.
While Yellen’s speech has brought both criticism and commendation, the spotlight on inequality cast by the Fed’s outsized influence may further the Fed Chair’s “hope that further research will help answer” the many remaining questions.


